Hosseg.com

How Can We Help
If you need any helps, please feel free to contact us.
Call Us

+48 519 821 507

Or mail

contact@hosseg.com

metal pipe elbow with a grid pattern marked on its surface. The grid appears to be part of a non-destructive testing procedure, most likely ultrasonic thickness measurements (UT), used to assess the wall thickness and structural integrity of the pipe. Within the grid, there are various numbers and letters, which likely represent measurement values or specific inspection codes. A prominent yellow marking "F0121E01" is visible, which serves as an identifier for the pipe or inspection area. The pipe is bolted to a flange, indicating that it is part of a pressurized piping system, probably used in an industrial environment such as a refinery, chemical plant, or power station.

Comprehensive Testing and Measurement Services for Facilities

Hosseg delivers advanced facility testing and measurement supervision and execution services, critical for ensuring the reliability and safety of industrial installations. Our efforts focus on precisely assessing the technical condition of process equipment, energy machines, pipelines, and installations in facilities like conventional power plants, waste incineration plants, and complexes with flue gas treatment systems (e.g., desulfurization and dedusting installations).

We specialize in comprehensive diagnostics, using a risk-based inspection (RBI) approach to identify critical areas, minimizing failure risks, optimizing maintenance costs, and reducing downtime. Our offerings include:

  • Visual inspections, including drone-assisted—surface and hard-to-reach area checks.
  • Ultrasonic testing (UT)—detecting internal defects and material wear.
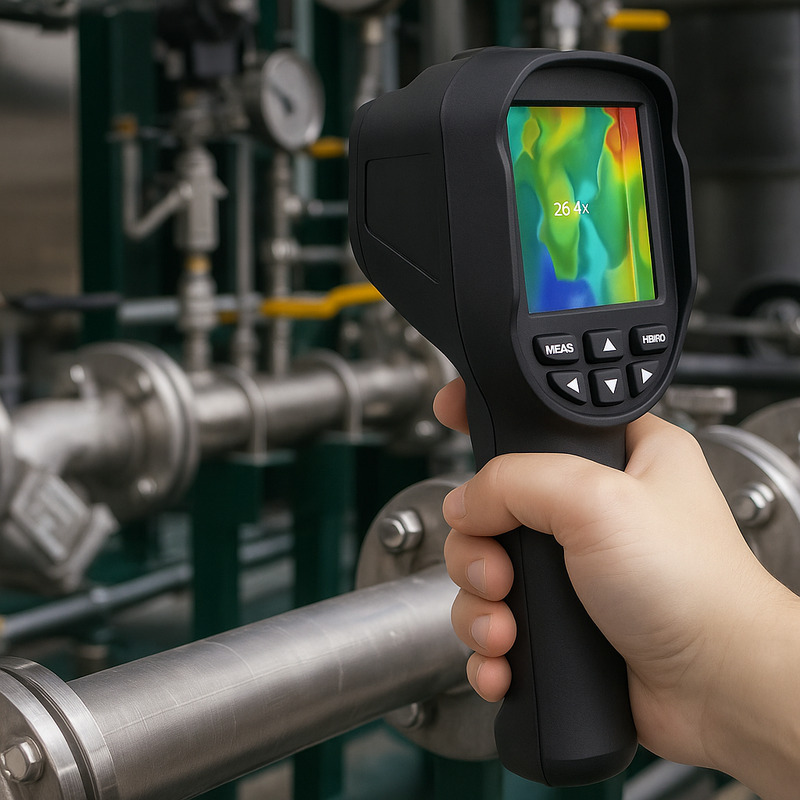
  • Thermographic testing—identifying thermal anomalies and insulation leaks.
  • Borescopic inspection—examining component interiors without disassembly.
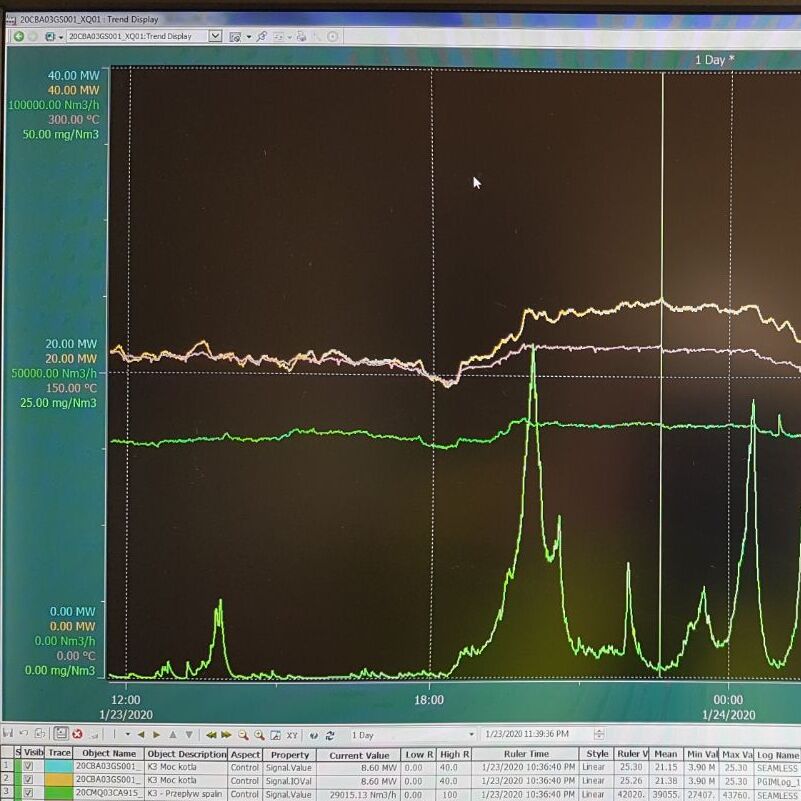
  • Flow measurements—analyzing media dynamics and optimizing transmission systems.
  • Energy equipment diagnostics—assessing the technical condition of energy machines.
  • Pressure installation diagnostics.

Pressure Installation Diagnostics

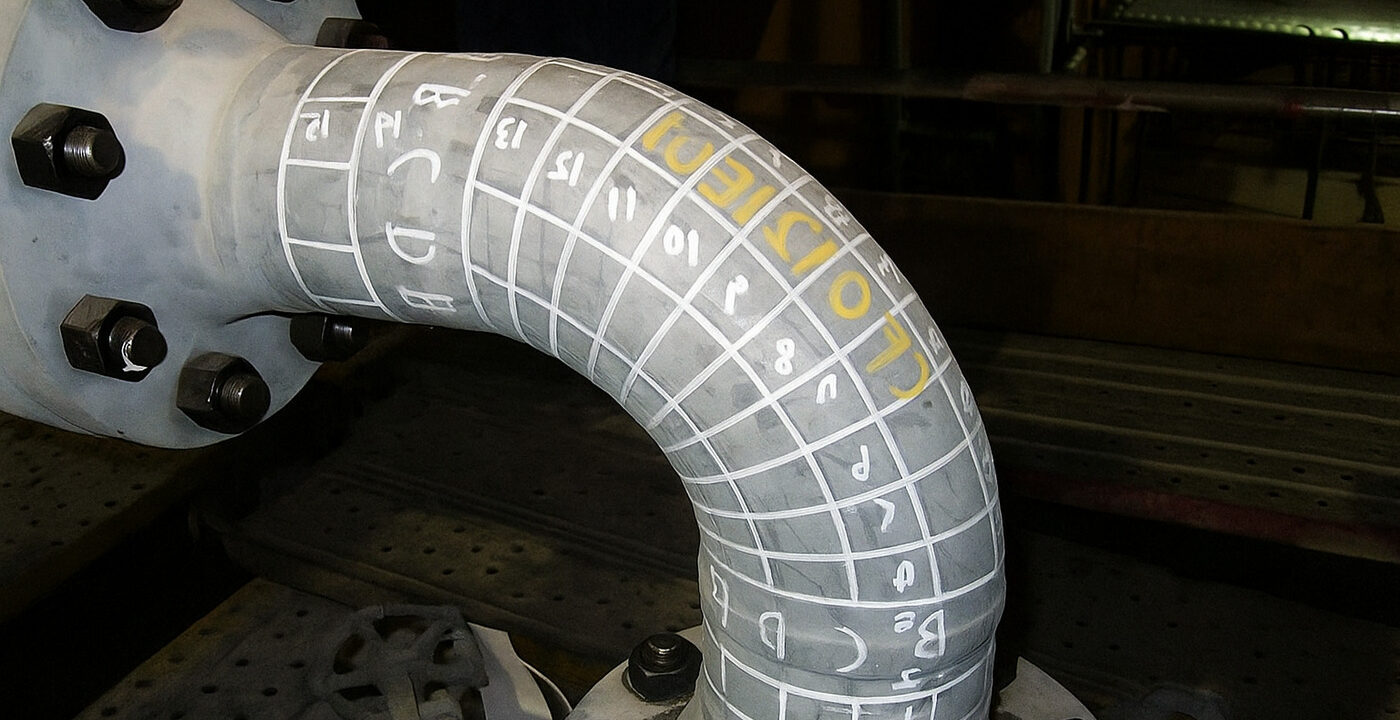
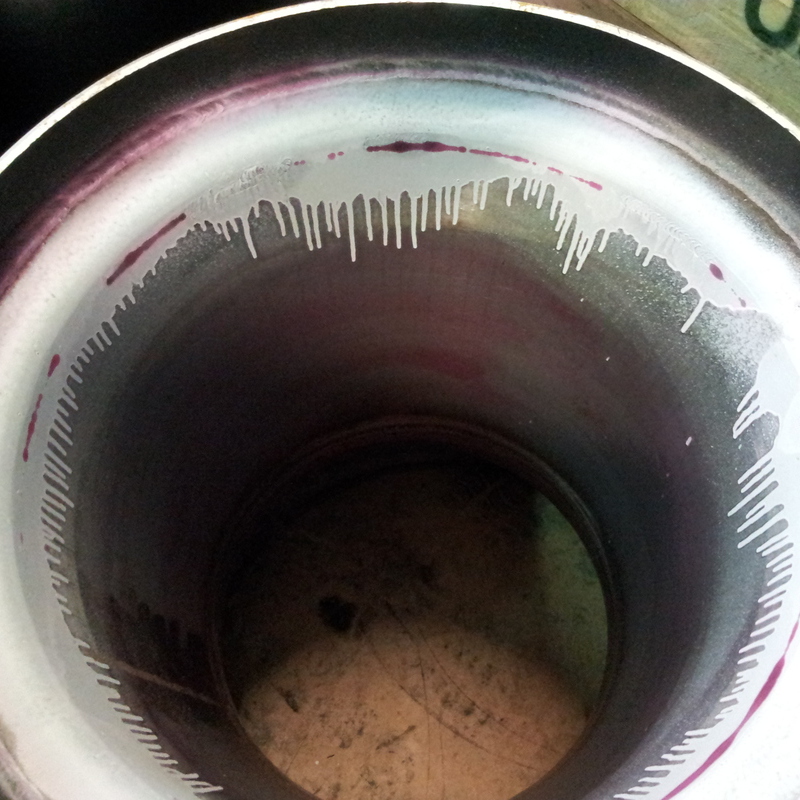
Pressure installations, compliant with international standards, require regular inspections to prevent failures. Degradation processes like fatigue cracks, material creep, corrosion-mechanical damage, or flow-assisted corrosion (FAC) are often invisible to the naked eye. Hosseg employs modern NDT techniques for early defect detection and full control over the technical condition of these components.

Our experts provide end-to-end management of testing and measurements, from operational data analysis and inspection strategy development to execution and result interpretation. We deliver detailed reports with recommendations for operation, maintenance, or modernization, ensuring compliance with ASME, API, and EN standards.

Combining innovative technologies with specialist expertise, we offer both supervision and independent testing execution. Our services enhance infrastructure reliability, extend installation lifespan, and reduce operating costs. Hosseg is a strategic partner supporting the stability and growth of industrial facilities at the highest level.

01.
Advanced Facility Diagnostics
cylindrical metal pipe. The inner surface has a shiny, polished look with some discoloration, showing purple and pink hues near the top edge. There are also white, drip-like marks running down from the edge, possibly indicating some residue or contamination. The bottom of the pipe appears darker and less reflective.

02.

Use of Modern Testing Methods
hand holding a thermal imaging device, displaying a colorful temperature image (in this case, 26.4°C) on its screen. The device is aimed at a system of pipes and valves in an industrial environment, likely a factory or industrial facility. The background includes metal pipes, valves, and other technical infrastructure elements.
03.
Specialized Pressure Installation Oversight
hand-drawn diagram on graph paper, likely related to an industrial or mechanical system. The diagram includes a section labeled "UNIT 1 - COCO" with "SHA = SH2" and a temperature note "(35°C ± 3)", a flow path with annotations like "CH = COLUMN" and "GAS FLOW", another section labeled "SH STEAM - UNIT 1 - COLD" with a temperature note "(80°C)" and various markings such as "CH = cold mark", "CH = 20", "CH = 100 (cold pressure = 10)", and "common", symbols for "SNUBBERS" with "YELLOW" and "RED" labels, several "X" marks and lines indicating connections or measurements, with notes like "S. = cold" and "temp" (90.03.16), the diagram appears to be a schematic or process flow chart, possibly for a heating or cooling system.
04.
Full Testing Management and Operational Recommendations
computer screen displaying a trend display interface, likely from an industrial monitoring system. The graph covers a 1-day period from 1/23/2020 to 1/24/2020, with time on the x-axis and various units on the y-axis (e.g., MW, mg/Nm3, °C). Multiple data lines are plotted in different colors, representing different parameters such as power output, emissions, or temperature. The y-axis ranges include 0.00 to 40.00 MW, 0.00 to 50.00 mg/Nm3, and 0.00 to 300.00 °C. The graph shows fluctuating data, with a significant peak around 18:00 on 1/23/2020, and another series of peaks and dips later in the day. The interface includes a legend with labels like "VLSI Trace Object Name," "Description," "Aspect," "Property," "Current Value," "Low R," "High R," "Style," "Mean," "Min Val," "Max Val," and "Log Name," with specific values for different traces (e.g., 8.60 MW, 6.60 mg/Nm3). The screen also shows a cursor and ruler for detailed analysis, with timestamps and values visible.